
Five seasons of Formula 1, turned into a site you can question.
RI360 takes raw race timing data and makes it readable: who was fast, what each tyre cost, and what would have happened on a different strategy. I built the data pipeline, designed the screens and wrote the site.
- Project
- Self-initiated product
- My role
- Data pipeline, design, front end
- Built with
- Python, FastAPI, React, TypeScript
- Status
- Live
- 96,223laps analysed
- 89races, 2019 to 2023
- 86race models fitted
- 100%of checked lap times match the raw feed
One design system, two themes
Paper is for reading an analysis. Pit wall is for watching numbers. Both come from the same set of design tokens, so every page works in either. Drag the handle to switch.
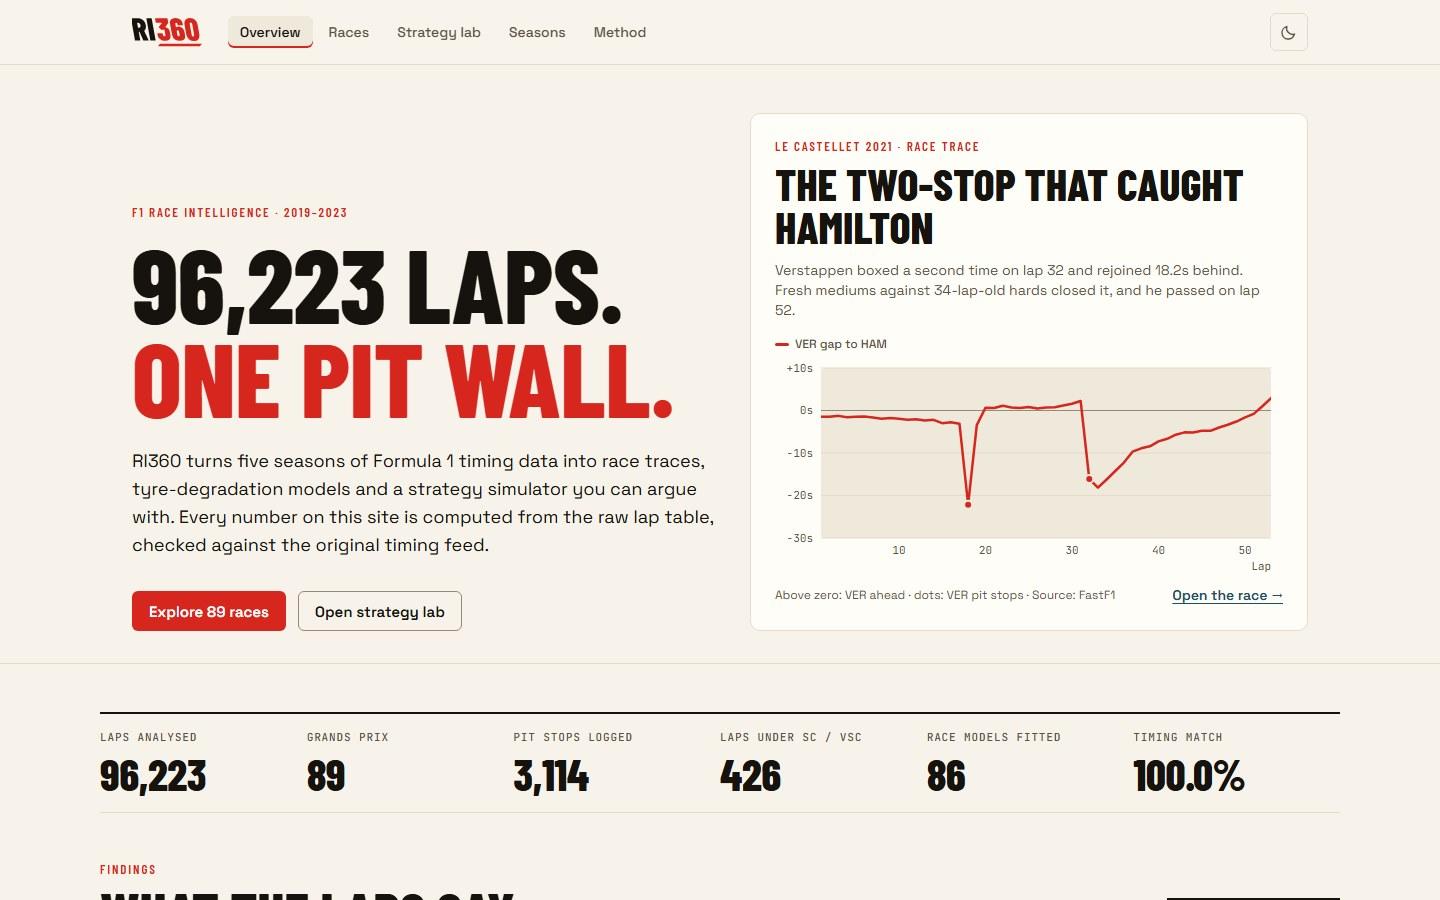
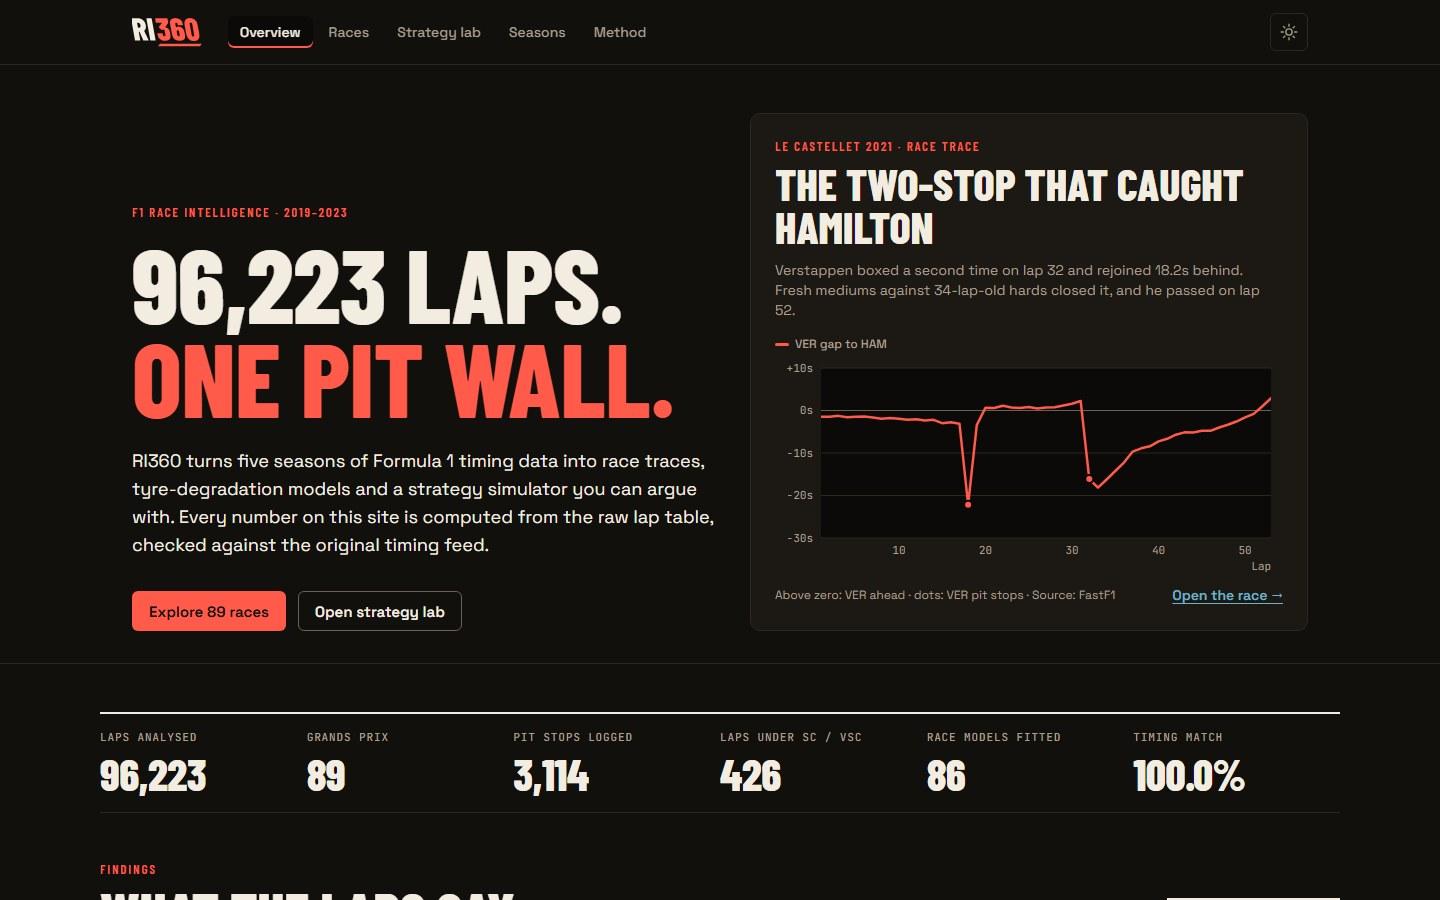
The data was counting laps twice
Before designing anything I profiled the lap table the first version of this project had exported. Almost a quarter of it was wrong.
- 124,209
rows in the exported lap table
This is what the earlier model had been trained on.
100% of the original export - 27,986
of them were the same lap stored twice
23,038 in 2022 and 4,948 in 2023. That is 22.5% of the export. The duplicates had also doubled the stint-age value the old model learned from.
22.5% of the original export - 96,223
real laps left after removing them
I also rebuilt 612 missing tyre ages and kept 368 laps with an unknown tyre out of the tyre analysis.
77.5% of the original export - 94,490
lap times checked against the raw timing feed
Every one of them matches to the millisecond. Only then did I build charts on top.
76.1% of the original export
Five decisions and the reason for each
Each one traded something away. I have said what.
- 01
One equation instead of a black box
- Problem
- The first version used a Random Forest. It could not explain a prediction, and it had learned from the duplicated laps.
- What I did
- Each race now gets one fitted equation: lap time = driver + fuel × laps left + tyre compound + wear × tyre age. Its median error on laps held out from training is 0.47 seconds, across 86 races.
- What it costs
- It treats tyre wear as a straight line, and three wet races get no model at all.
- 02
Measure the pit stop, don't assume it
- Problem
- The old simulator charged a fixed 22 seconds for every pit stop at every circuit.
- What I did
- I measure it from the laps: in-lap plus out-lap, minus two normal laps. A stop costs about 18.6 seconds at Spa and 29.5 at Lusail, which decides whether an extra stop can ever pay.
- What it costs
- It needs enough green-flag stops at a circuit to be trusted.
- 03
Grade every model in public
- Problem
- A model that fits one race well can fit another badly, and a chart hides that.
- What I did
- Every fit carries a grade. 60 races have a wear rate per tyre, 12 share one rate, 7 are marked weak and 7 are mixed wet-and-dry races. The Method page lists what the model does not know.
- What it costs
- Some races show less than others, on purpose.
- 04
No server
- Problem
- A site that needs a database and an API is slow to load and costs money to keep running.
- What I did
- The pipeline writes everything as 4.6 MB of static files: one index and one file per race. The strategy lab runs the equation in the browser and tries every one-stop and two-stop plan.
- What it costs
- New races need the pipeline to be run again and the site redeployed.
- 05
Draw the charts by hand
- Problem
- Chart libraries bring their own look, and a race trace with twenty drivers needs careful control.
- What I did
- Every chart is hand-built SVG, using d3 only for scales and line shapes, styled from the same tokens as the rest of the site.
- What it costs
- Each new chart type is real work.
Run the model yourself
This is the real fitted equation for the 2022 Abu Dhabi Grand Prix, running in your browser with the numbers from the site's data file. Pick the tyres and the pit lap.
2022 Abu Dhabi Grand Prix · 58 laps · winner's pace
Medium 20 laps, Hard 38 laps
- Predicted race time
- 1:27:44.6
- Compared with the fastest one-stop plan
- +0.0s
This is the fastest one-stop plan the model can find. It is also the plan the winner really ran: medium tyres for 20 laps, then hard.
No traffic, safety cars or tyre warm-up. Pit stop cost measured for this race: 24.0 seconds.
Six pages, each with one job
Choose a page to see it.
Headline findings from the data: what a pit stop costs at each circuit, how fast each tyre wears, and who dominated each season.
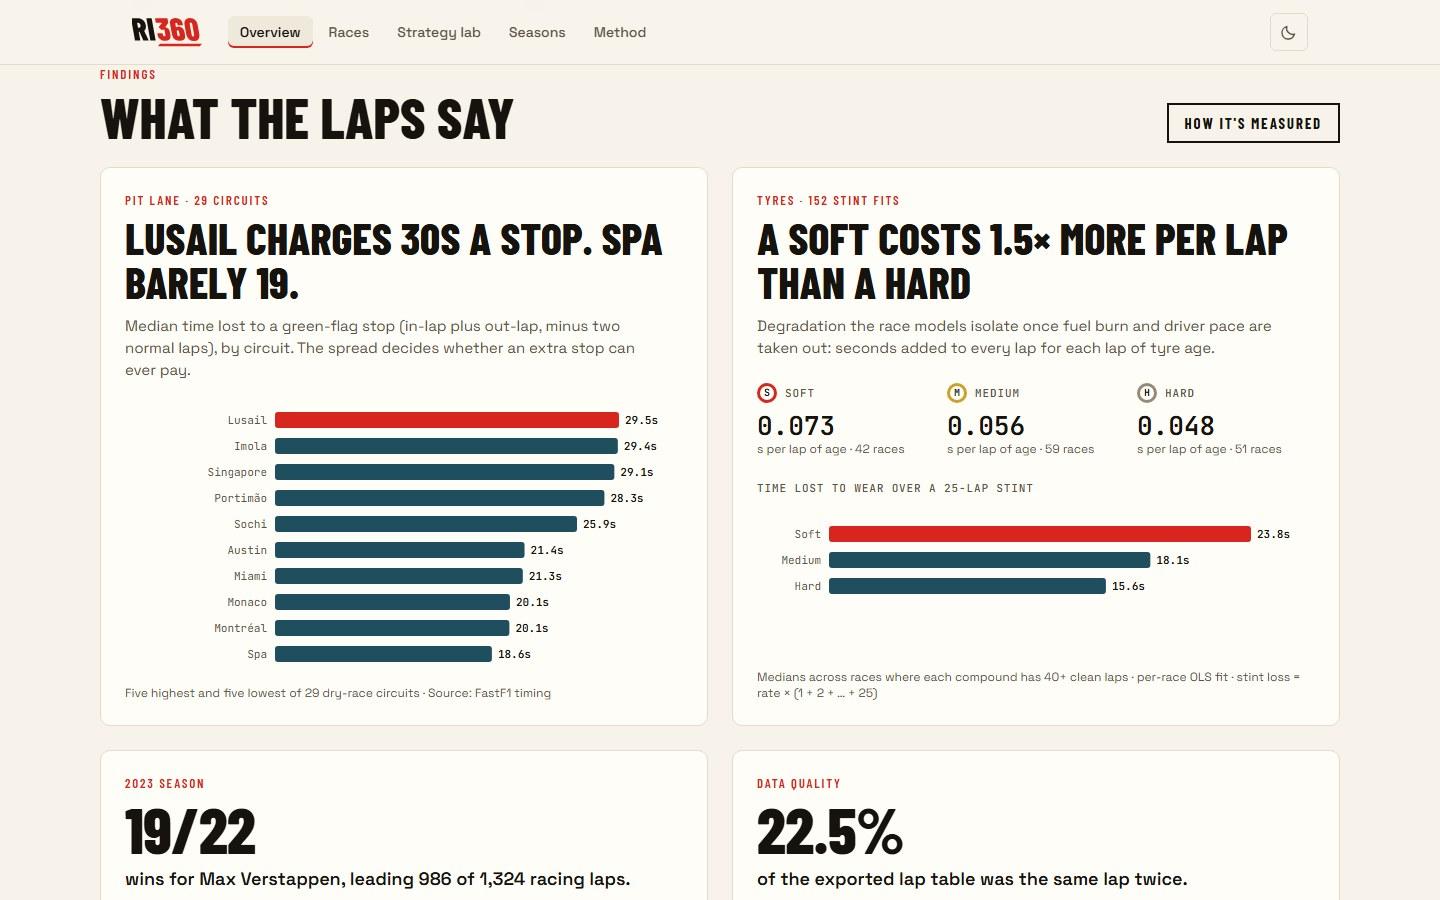
On a phone
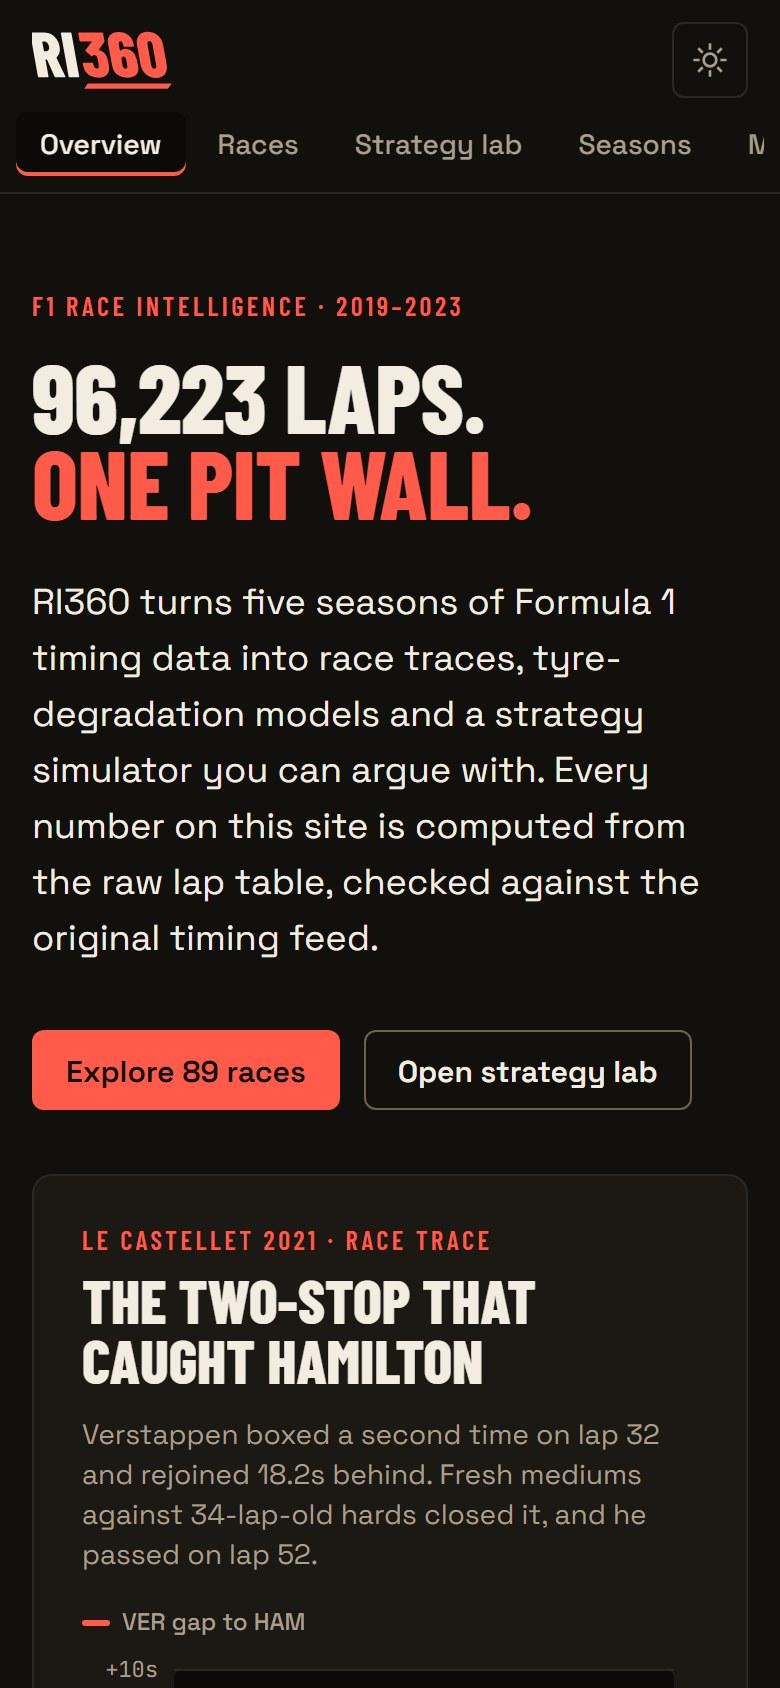
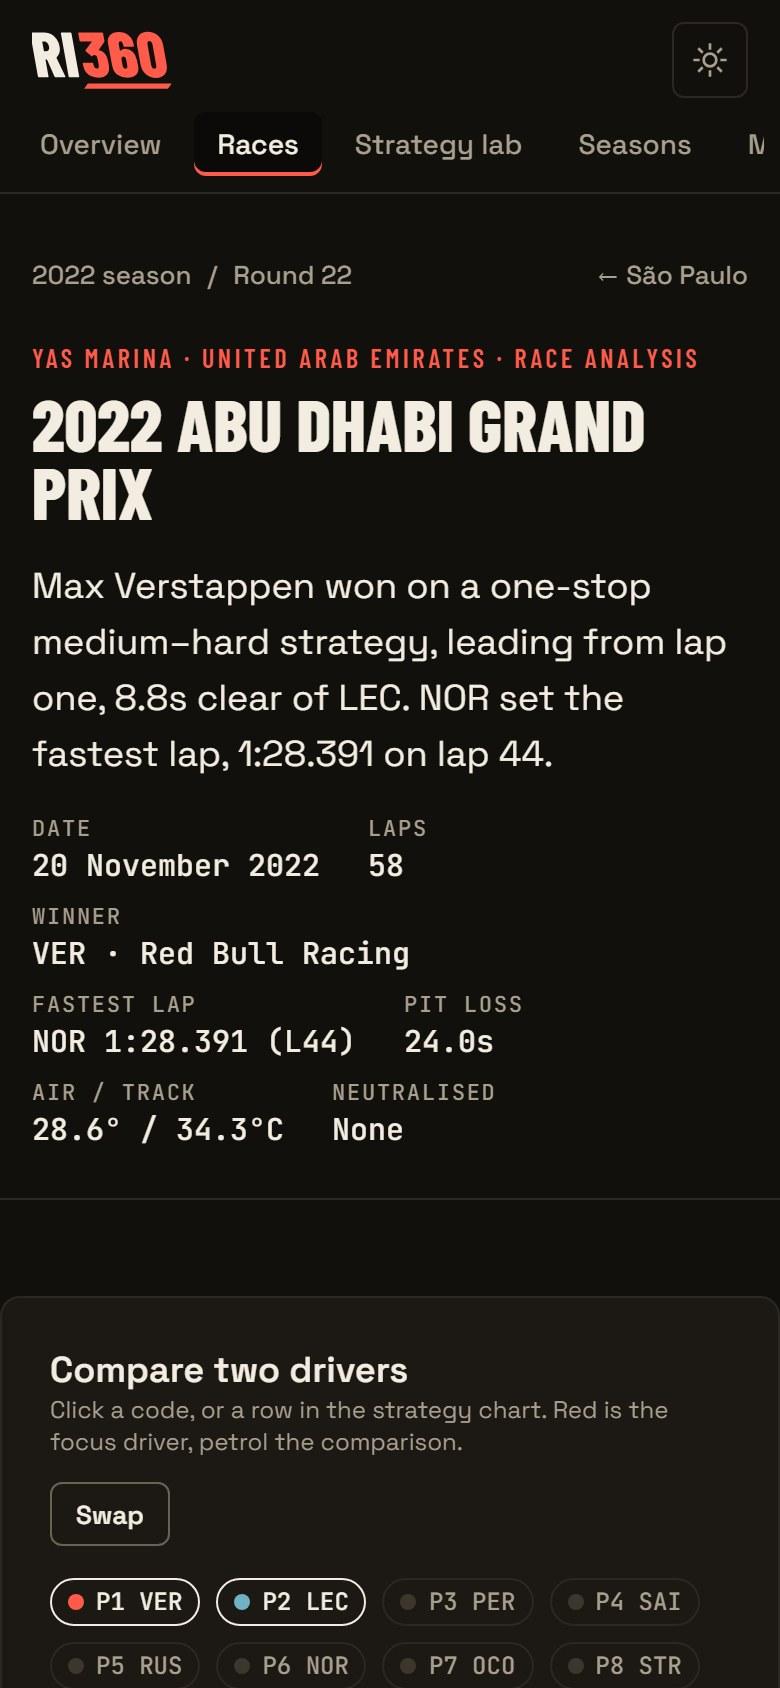
Designed in Figma before it was built
The Figma file holds every page in three versions, plus the shared parts.
- 6pages designed for desktop in the paper theme
- 6of the same pages for a 390 px phone
- 6again for desktop in the pit wall theme
- 3shared components: the site header and two footers
Type is Barlow Condensed for headlines, Space Grotesk for text and JetBrains Mono for numbers.
Open the Figma fileFrom timing feed to website in four steps
- 01
Collect
A Python script uses the open-source FastF1 library to download race timing, tyre and weather data. A FastAPI service stores it in SQL: SQLite on my machine, Postgres in production.
- 02
Clean
Remove duplicate laps, rebuild tyre ages, and compare every lap against the raw timing feed. Safety-car and red-flag periods are mapped to laps from the track-status feed.
- 03
Model
Fit one pace equation per race on clean laps only, and score it on a random 20% of laps it has not seen.
- 04
Ship
Write the result as static files and build the site. GitHub Actions checks on every push that the site builds and the API starts.
What it does not do
- The model knows nothing about traffic, dirty air, safety-car timing or tyre warm-up. It compares plans; it does not predict races.
- The 2021 season holds rounds 1 to 7 only.
- The live site does not use the API. All its data ships with it.
Timing data comes from the FastF1 library. RI360 is an independent project and is not affiliated with Formula 1, the FIA or any team.
Have data that nobody can read yet?
I can clean it, model it and design the product that shows it.